
目录
一. 实验环境
本次的实验环境见下表:
| 操作系统 | 服务器 IP | hostname |
|---|---|---|
| centos7.6 | 192.168.1.41 | mufengrow41 |
| centos7.6 | 192.168.1.42 | mufenggrow42 |
如何查看相应的参数:
- 查看操作系统:
[root@mufenggrow ~]# cat /etc/redhat-release
CentOS Linux release 7.6.1810 (Core)
- 查看 hostname
## 修改hostname
[root@mufenggrow ~]# hostnamectl set-hostname mufenggrow41
[root@mufenggrow ~]# bash
# 查看hostname
[root@mufenggrow41 ~]# hostname
mufenggrow41
- 查看 ip
[root@mufenggrow41 ~]# ifconfig |grep inet |awk 'NR==1{print $2}'
192.168.1.41
本文中的 master 服务器,也就是 prometheus 已经安装好,如果你还未安装,可以参考上一篇文章:prometheus 安装及使用入门
二. 安装 node_exporter
2.1 node_exporter 的介绍
官网给提供了数据采集的组件: node_exporter, prometheus 只能拉取数据,而 Exporter 是 Prometheus 的指标数据收集组件。
它负责从目标 Jobs 收集数据,并把收集到的数据转换为 Prometheus 支持的时序数据格式。
和传统的指标数据收集组件不同的是,它只负责收集数据,并不向 Server 端发送数据,而是等待 Prometheus Server 主动抓取。
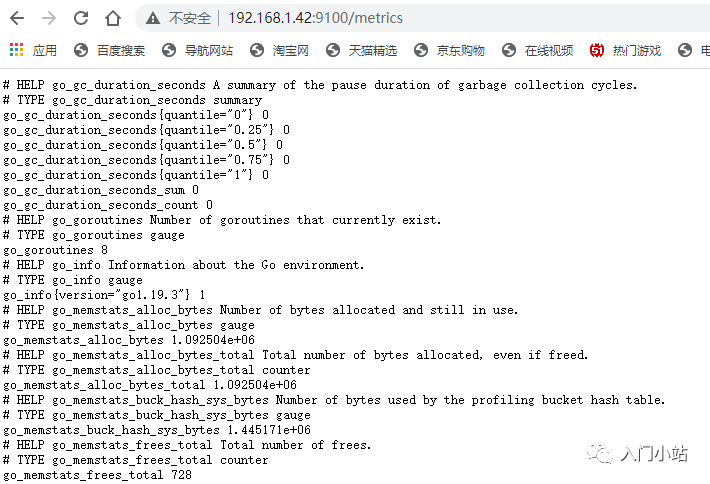
node-exporter 默认的抓取 url 地址:http://ip:9100/metrics
如果想要让 node_exporter 推送数据,可以借助于工具 pushgetway 组件,这个组件可以推送 node_exporter 的指标数据到你安装好的 prometheus 服务器上。
node-exporter 用于采集 node 的运行指标,包括 node 的 cpu、load、filesystem、meminfo、network 等基础监控指标,类似于 zabbix 监控系统的的 zabbix-agent
2.2 node_exporter 的安装
1. 上传 node_exporter
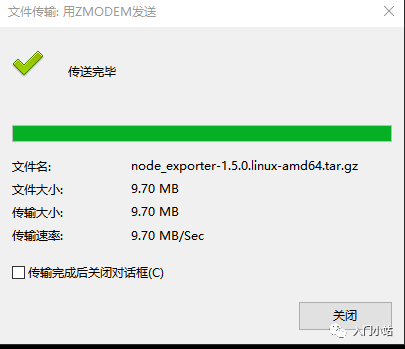
2. 解压并启动
- 解压 node_exporter
[root@mufenggrow42 ~]# tar xf node_exporter-1.5.0.linux-amd64.tar.gz
#包的名字太长,这里改的短一点
[root@mufenggrow42 ~]# mv node_exporter-1.5.0.linux-amd64 node_exporter
[root@mufenggrow42 ~]# cd node_exporter
[root@mufenggrow42 node_exporter]#
- 关于启动 exporter 的参数
上面我们已经解压了,如果要安装,我们需要使用 node_exporter --help 来查看完成的参数:
[root@mufenggrow42 node_exporter]# ./node_exporter --help
usage: node_exporter [<flags>]

Flags:
  -h, --help                     Show context-sensitive help (also try --help-long and --help-man).
      --collector.arp.device-include=COLLECTOR.ARP.DEVICE-INCLUDE
                                 Regexp of arp devices to include (mutually exclusive to device-exclude).
      --collector.arp.device-exclude=COLLECTOR.ARP.DEVICE-EXCLUDE
                                 Regexp of arp devices to exclude (mutually exclusive to device-include).
      --collector.bcache.priorityStats
                                 Expose expensive priority stats.
                                 ...(省略)
默认情况下, node_exporter 在端口 9100 上运行,并在路径 /metrics 上暴 露指标,此处也可以修改,比如:
可以通过–web.listen-address 和 --web.telemetry-path 参数来设置端口和路径:
[root@mufenggrow42 node_exporter]# ./node_exporter --web.listen-address=":9800"
修改端口为 9800.
(关于启动时候的一些参数,我们在后面的文章中详细介绍,本文只启动 node_exporter,实现监控远程主机即可)
- 开始启动 node_exporter
[root@mufenggrow42 node_exporter]# nohup ./node_exporter &
[1] 19459
启动并设置在后台运行,这里 nohup 命令,主要用于在系统后台不挂断地运行命令,退出终端不会影响程序的运行。
nohup 命令,在默认情况下(非重定向时),会输出一个名叫 nohup.out 的文件到当前目录下,如果当前目录的 nohup.out 文件不可写,输出重定向到 $HOME/nohup.out 文件中。
- 查看启动情况:我们可以查看端口是否启动:
[root@mufenggrow42 ~]# lsof -i:9100
COMMAND     PID USER   FD   TYPE DEVICE SIZE/OFF NODE NAME
node_expo 19459 root    3u  IPv6  59483      0t0  TCP *:jetdirect (LISTEN)
- 查看监控信息:我们从网页端查看监控信息:
三. 在 prometheus 服务端配置监控远程主机
3.1 在 server 端配置拉取 node 的信息
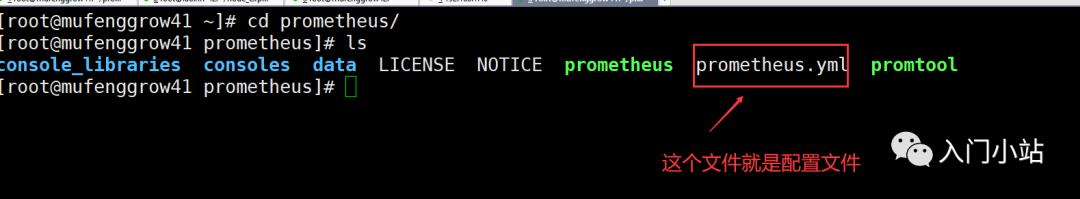
找到我们的配置文件:
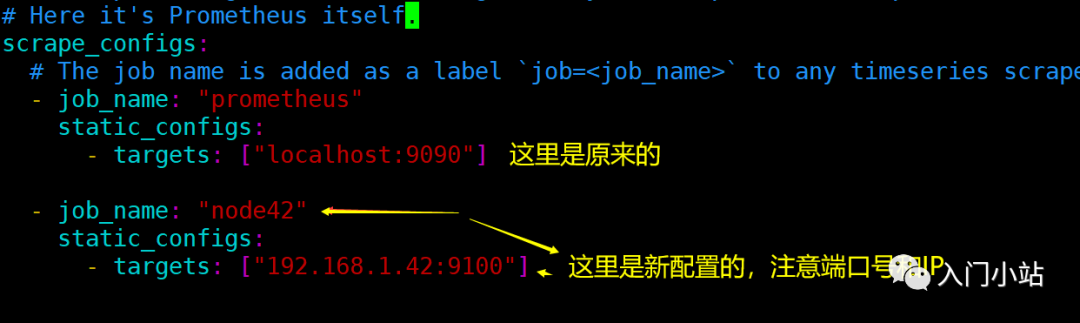
 打开配置文件进行设置:在最后面添加 node 的信息:
scrape_configs:
  # The job name is added as a label `job=<job_name>` to any timeseries scraped from this config.
  - job_name: "prometheus"
    static_configs:
      - targets: ["localhost:9090"]

  - job_name: "node42"
    static_configs:
      - targets: ["192.168.1.42:9100"]
如图所示:
3.2 重启 prometheus
两种方法重启:
- 方法一: 直接使用 pkill 杀死进程,然后重启
#杀死promethues
[root@mufenggrow41 prometheus]# pkill prometheus
# 再次启动
[root@mufenggrow41 prometheus]# ./prometheus &
- 方法二: 后台运行 prometheus 的方式重启
1)配置 prometheus server 的 systemd 文件
# vim /usr/lib/systemd/system/prometheus.service
[Unit]
Description=Monitoring system and time series database
Documentation=https://prometheus.io/docs/introduction/overview/
After=network.target

[Service]
Restart=on-failure #表示当进程以非零退出代码退出,由信号终止;
#当操作(如服务重新加载)超时;以及何时触发配置的监视程序超时时,服务会自动重启。
WorkingDirectory=/apps/prometheus/ #工作目录,路径根据需求修改
ExecStart=/apps/prometheus/prometheus  --config.file=/apps/prometheus/prometheus.yml
#/apps/prometheus/prometheus:二进制启动文件
#--config.file #配置文件的路径,启动prometheus指定要读取那个配置文件。(配置文件路径根据需求修改)
User=prometheus #启动用户

[Install]
WantedBy=multi-user.target
2.添加 prometheus 用户
useradd -M -r -s /usr/sbin/nologin prometheus
此命令的解释: -M:创建用户时不创建该用户的家目录,也就是在 / home 目录中没有该用户的目录。(该选项可选择性添加) -r:创建的用户为系统用户。(该选项可选择性添加) -s:指定用户的 shell。
3)给 prometheus 二进制文件修改所属主和所属组
# chown -R prometheus.prometheus /apps/prometheus-2.37.5.linux-amd64
4) 启动 prometheus
#重新读取所有的service文件
# systemctl daemon-reload
#该命令有启动prometheus和设置prometheus开机的作用
# systemctl enable --now prometheus

# ps -ef | grep prometheus
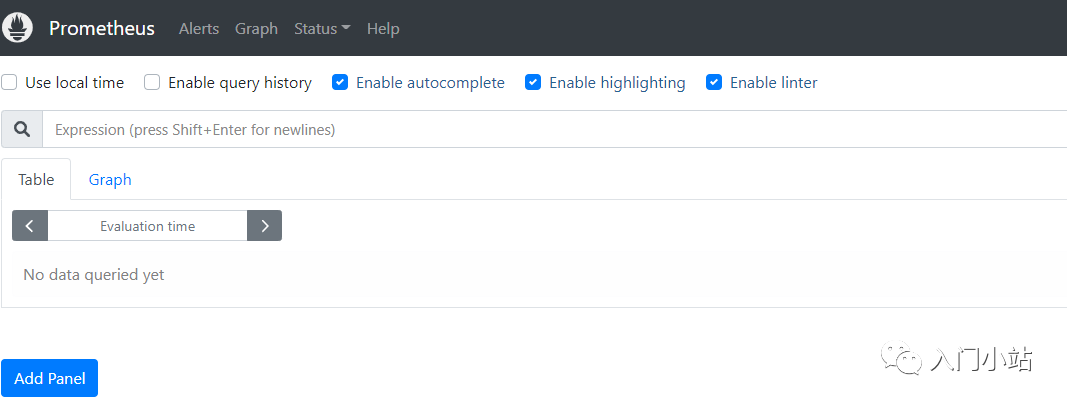
3.3 通过浏览器查看 prometheus
打开 prometheus 的地址:输入访问地址: 192.168.1.41:9090
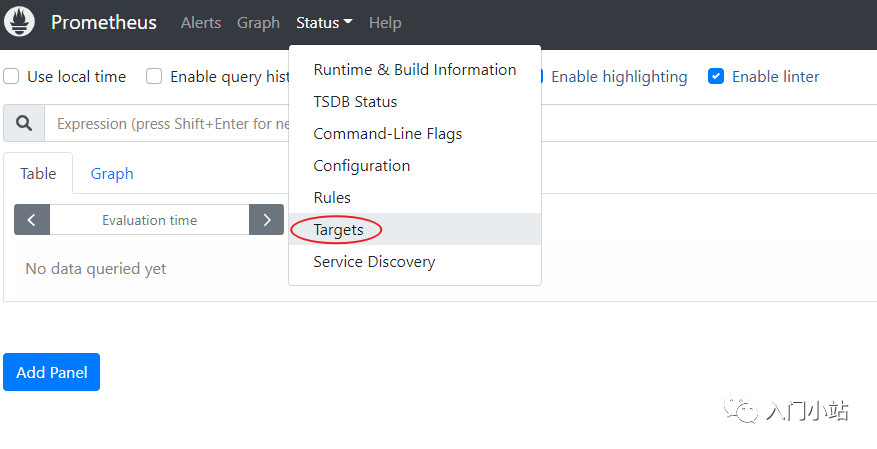
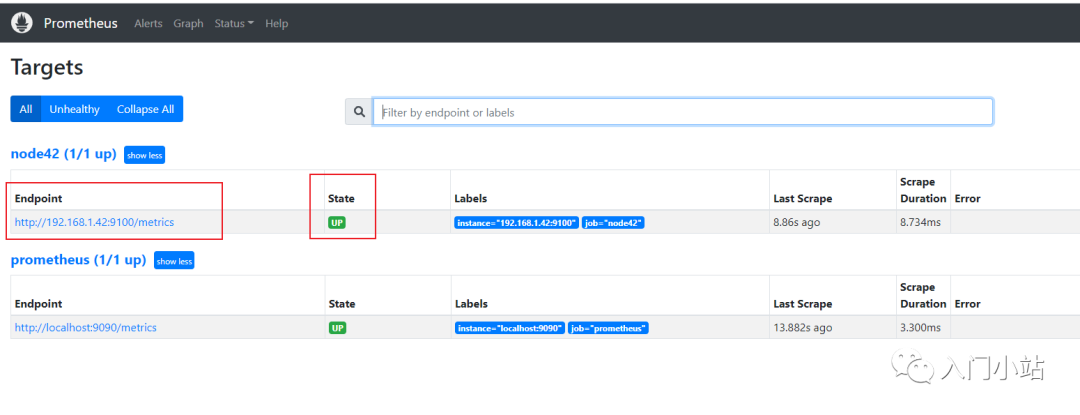 可以看到,已经监控到了远程主机的信息
从下图可以看到监控的详细参数:比如我们查看 cpu 的使用时间:
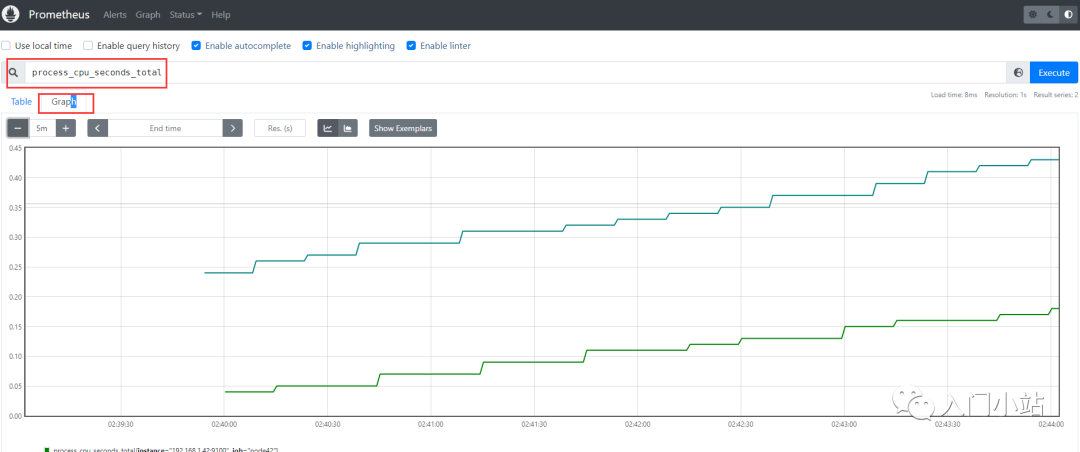
process_cpu_seconds_total 用户和系统的总 cpu 使用时间


本文作者:Gustav
本文链接:
版权声明:本博客所有文章除特别声明外,均采用 BY-NC-SA 许可协议。转载请注明出处!